Prometheus Integration
Chainloop integrates with Prometheus, allowing end users to gain insights into their CI/CD pipelines automatically, in an standardized way.
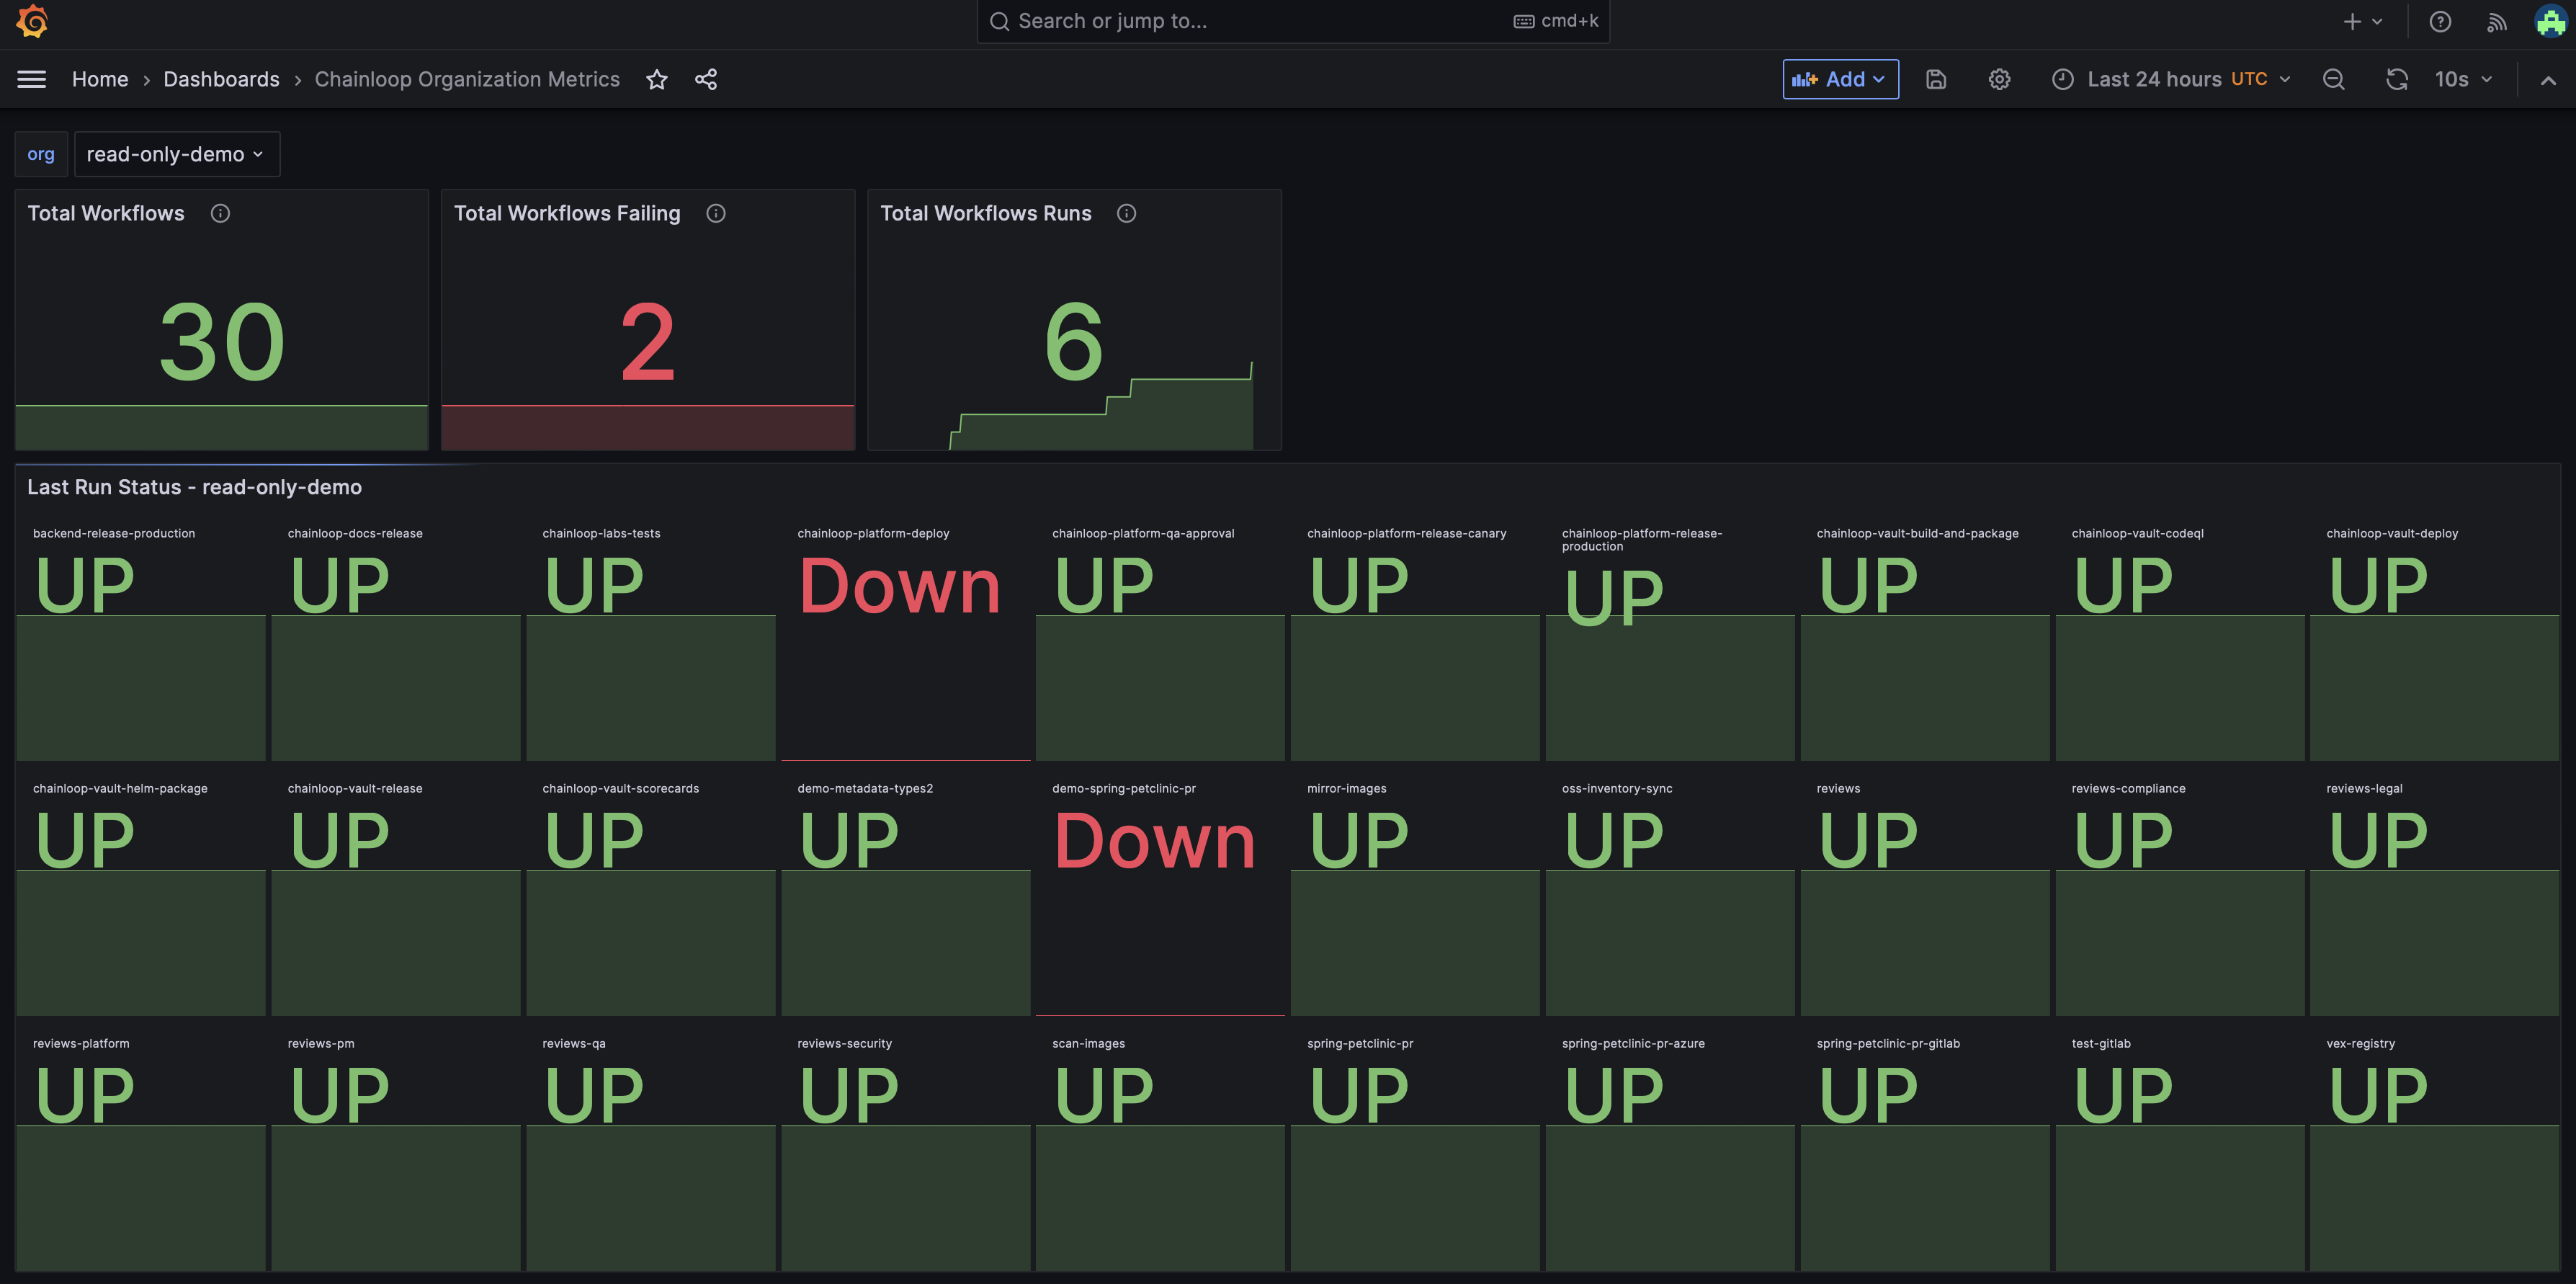
chainloop_workflow_up: Indicate if the last run was successful.chainloop_workflow_run_duration_seconds: Duration of a workflow runs in seconds.
CHAINLOOP_CONTROLPLANE_URL: The URL of your Chainloop control plane.ORG_NAME: The name of the organization from which to gather metrics.
- Prometheus Integration is activated for the organization.
- A valid API Token is included in the metrics request.
How to activate Prometheus Integration?
In order to use the Prometheus integration there a few steps that need to be performed:- Create or use an existing Chainloop organization.
- Generate an API Token for the organization.
- Update Chainloop Controlplane configuration to activate prometheus endpoint for that org.
Create or use an existing Chainloop organization
If you already have a Chainloop Organization, you only need to know its name. If you don’t have an existing Chainloop Organization, log in and run the following command:Generate an API Token for the organization
Make sure your current organization is the one you want to create an API Token for and run the following replacingAPI_TOKEN_NAME with your desired API Token name:
Update Chainloop Controlplane configuration
When using the Chainloop Open Source Chart, there are a few configurations you can tweak to activate the integration of an existing organization. On your values.yaml add:prometheus_org_metrics entry to the top level controlplane key. The value org_name: cyberdyne refers to the fact that we want to activate the metrics for the organization with the name cyberdyne.
If you want to activate it for more organizations, simply add them below:
Test the metrics endpoint
With the generated API Token and changed configuration, we can test that everything works as expected by making a request to the Chainloop’s Controlplane to gather metrics for cyberdyne organization:How to connect to your Prometheus instance?
Depending on how Prometheus is deployed in your infrastructure, there could be several ways to do it, the most common way is by updating the configuration yaml of Prometheus:chainloop-metrics with several options, the most important ones:
- metrics_path:
/prom/cyberdyne/metrics - bearer_token: The Chainloop API Token previously generated
- target:
https://CHAINLOOP_CONTROLPLANE_URL
What’s next?
Having these metrics is quite powerful, as they enable you to consider further integrations and data visualization methods, such as using Grafana. You can also set up alerts based on these metrics with Alertmanager. Below is an example of visualization using Grafana within a real Chainloop organization.

